Difference between revisions of "IP PBX Manual Reporting"
| Line 118: | Line 118: | ||
Queue Graphs display additional call information for ACD Queues. A PBX must be licensed for ACD for this button to appear. | Queue Graphs display additional call information for ACD Queues. A PBX must be licensed for ACD for this button to appear. | ||
| − | + | [[File:queuegraphs.png|center]] | |
{| style="border-spacing:0" | {| style="border-spacing:0" | ||
| Line 155: | Line 155: | ||
The Overview Tab offers an overall summary of the calls for the period in question for that queue. The overview will display textual information for answered and unanswered calls, as well as a graph summarizing the information. | The Overview Tab offers an overall summary of the calls for the period in question for that queue. The overview will display textual information for answered and unanswered calls, as well as a graph summarizing the information. | ||
| − | + | [[File:overviewtab.png|center]] | |
{| style="border-spacing:0" | {| style="border-spacing:0" | ||
| Line 188: | Line 188: | ||
The Agents tab displays details for queue members. | The Agents tab displays details for queue members. | ||
| − | + | [[File:agentstab.png|center]] | |
{| style="border-spacing:0" | {| style="border-spacing:0" | ||
| Line 214: | Line 214: | ||
The Graph Tab provides a graphical view of queue calls only. Inbound and outbound calls are tabulated but not graphed. The graph tab divided into time segments defined by the Sorting setting set previously. The information presented in this tab will allow you to determine busiest times and when call coverage is most needed. | The Graph Tab provides a graphical view of queue calls only. Inbound and outbound calls are tabulated but not graphed. The graph tab divided into time segments defined by the Sorting setting set previously. The information presented in this tab will allow you to determine busiest times and when call coverage is most needed. | ||
| − | + | [[File:graphtab.png|center]] | |
===== Logs Tab ===== | ===== Logs Tab ===== | ||
The Logs Tab will display the complete call log for the queue from your search setting. It will display the time of the call, the direction of the call either inbound or outbound, the caller ID that was delivered with the call, the location that the call was delivered to, the wait time for the caller, the total duration of the call, and finally the outcome of the call or the final status of the call. See the table for CDR Report Descriptions for detailed information about the fields. | The Logs Tab will display the complete call log for the queue from your search setting. It will display the time of the call, the direction of the call either inbound or outbound, the caller ID that was delivered with the call, the location that the call was delivered to, the wait time for the caller, the total duration of the call, and finally the outcome of the call or the final status of the call. See the table for CDR Report Descriptions for detailed information about the fields. | ||
| + | [[File:logstab.png|center]] | ||
Revision as of 17:37, 23 May 2013
.gif)
Reporting
Reports
The Call Data Records (CDR) contain information about calls collected from the IPitomy IP PBX for a specified period of time. The report details the number of calls, call duration, call origination, call destination, and status.
Call Data Records (CDR) can be sorted by specific time periods. CDR may also be exported in the same date range format. The records have also been enhanced for easier reading, and comprehension of data. To sort simply select the date range you wish to be displayed, and then press the view button. The display will be arranged and sorted according to your date selections.

| Date/Time | The date and time of the call. |
| Direction | Defines where the call originated:
Internal: The call took place entirely within the PBX Outgoing: An internal entity made a call out a trunk. Incoming: An external party made a call inbound over a trunk. |
| Source | The originating party for the call. |
| Destination | The end location for the call. |
| Trunk | Defines which trunk was used for the call. |
| Duration | The length of the call in hours:minutes:seconds. |
| Status | The status describes the final state of a call through the PBX:
Adandoned: Call entered a Queue, but the caller hung up before the call was answered or met the failover requirement. ChanUnavail: No channel was able to be created for the call due to a possible error state for the intended destination. Agent Completed: Connected Queue call was terminated at the extension. Hangup: Call to a Menu, but the caller hung up before taking any actions. Caller Completed: Connected Queue call was terminated at the calling parties end. Cancel: Call from an Extension, but the caller hangs up before the call is connected. Answer: A connected call. No Answer: A call that met the ring time of an extension without being answered. Timeout Exit: Call to a Queue that meets the Timeout. VM Not Left: Call ended with the caller being sent to voicemail where they did not leave a message. VM Left: Call ended with the caller being sent to voicemail where they left a message. Transferred: Connected call successfully transferred. Busy: Call out a trunk returned busy status, or extension was busy. Note: Defines the call is still active, and the status will update when completed. Click on the call record for details. Exited Empty Queue: Call to Queue that follows Exit Empty rule. Exited With Key: Call to Queue that follows the Exit Menu key press |
View CDR ReportSmart Personal Console
IPitomy PBX Software version 3.4.1 and above have the added ability to view CDR Reports and Queue data from Smart Personal Console (SPC) using a special user name and password.
STEPS to access CDR and Queue Graphs via Smart Console Console:
- Within PBX Administration, navigate to the PBX Setup=>General page
- Locate to the General Settings section (second section from the top).
- Locate the SPC Reports User Password field (bottom of section)
- It may be helpful to change this to a user-friendly password. If you change the password be sure to
 and Apply Changes .
 - Make a note of this password.
- On the PC that will be used to access CDR Reports and Queue Graphs via SPC, open a web browser and navigate to the IPitomy PBX login screen
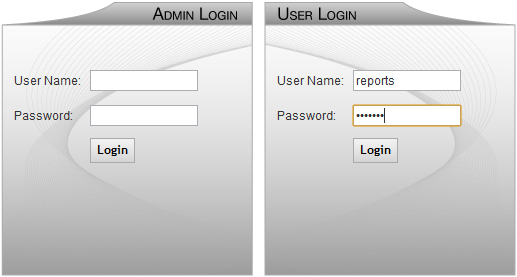
- Using the right sideSmart Personal Console (User Login) input the word “reports” as the user name and the password that you noted previously.
- Click on Login.
- The CDR-Report page is opened, use the instructions below to extract the data you wish. Or,
- Click on Queue Graphs to open that interface and use the instructions below to extract that data.

View CDR ReportPBX Administration
STEPS:
- From the Reporting=>Reports page, click on the CDR Report button. The CDR Report page appears.
- Select the From and To date range by click on the box next to the From and To fields. Use the calendar control page that appears to select the desired dates.
- Click the View button. A report with call information from the date range parameter that was entered is displayed.
- Click on an individual call record and a new window will appear displaying more detailed information for that call.
Export CDR Report
The Export function will provide you with a tabulated report to download to a PC.
STEPS:
- From the Reporting=>'Reports page, click on the CDR Report' button. The CDR Report page appears.
- Enter the date range and retrieve the report that you want to export (see steps for Viewing Report).
- Click the Export button then specify the location where you want to download the report.
Queue Graphs
Queue Graphs display additional call information for ACD Queues. A PBX must be licensed for ACD for this button to appear.

| Queue Type |
This is the listing of the queue you want to view. The drop-down list is populated with the various groups that have been configured. |
| Date |
This allows you to specify a range of dates for which call records will display. |
| Time |
This allows you to specify a start and end time within the date range for the reporting to display. |
| Setting |
This is the increment with which to sort by. The default increment is 2 hour. |
| Stretch Graph |
Move the slider to adjust the size of the graph to meet your viewing requirements. |
Run Queue Graph Report
STEPS:
- From the Reporting=>Reports page, click on the Queue Graphs button. The Queue Graphs page appears.
- Select the Queue Type from the drop-down list.
- Select the Start and End date using the calendar control that appears when you click on the date fields. Select the desired Start and End time for the reporting period you want to search.
- Change the Sorting parameters to the desired setting.
- Click the Update button. The system will perform the search based on the criteria that is specified and display the results.
Overview Tab
The Overview Tab offers an overall summary of the calls for the period in question for that queue. The overview will display textual information for answered and unanswered calls, as well as a graph summarizing the information.

| Total Calls |
Total number of calls answered, or unanswered. |
| Avg. Call Wait Length |
An average of the wait time for calls answered, or unanswered. |
| Min. Wait Length |
Shortest wait time for calls answered, or unanswered. |
| Max Wait Length |
Longest wait time for calls answered, or unanswered. |
| Avg. Call Length |
Average duration of an answered call. |
| Min. Call Length |
Shortest duration of an answered call. |
| Max Call Length |
Longest duration of an answered call. |
Agents Tab
The Agents tab displays details for queue members.

| Queue |
Time spent on queue calls. Number of calls displayed in parenthesis. |
| Inbound |
Time spent on inbound, non-queue calls. Number of calls displayed in parenthesis. |
| Outbound |
Time spent on outbound, non-queue calls. Number of calls displayed in parenthesis. |
| Internal |
Time spent on internal, non-queue calls. Number of calls displayed in parenthesis. |
| Pause Time |
Time spent paused out of the queue. Number of calls displayed in parenthesis. |
Graph Tab
The Graph Tab provides a graphical view of queue calls only. Inbound and outbound calls are tabulated but not graphed. The graph tab divided into time segments defined by the Sorting setting set previously. The information presented in this tab will allow you to determine busiest times and when call coverage is most needed.

Logs Tab
The Logs Tab will display the complete call log for the queue from your search setting. It will display the time of the call, the direction of the call either inbound or outbound, the caller ID that was delivered with the call, the location that the call was delivered to, the wait time for the caller, the total duration of the call, and finally the outcome of the call or the final status of the call. See the table for CDR Report Descriptions for detailed information about the fields.
