Difference between revisions of "Queue Monitoring"
John Wolfe (talk | contribs) (Created page with "{{IP_PBX_Manual|sortkey=Queue Monitoring}} '''Queue Monitoring''' Navigation to Reporting Queue Monitoring, gains access to the page in the following diagram. This allows you...") |
|||
| Line 20: | Line 20: | ||
[[File:Queue monitoring.jpg|File:Queue monitoring.jpg]] | [[File:Queue monitoring.jpg|File:Queue monitoring.jpg]] | ||
| + | |||
| + | Agent/Member Color Key: | ||
| + | Green: Idle (logged in) | ||
| + | Red: On a call | ||
| + | Yellow: Ringing | ||
| + | Grey: Unavailable (Not Logged In) | ||
| + | White: Paused | ||
Revision as of 19:18, 6 January 2015

Queue Monitoring
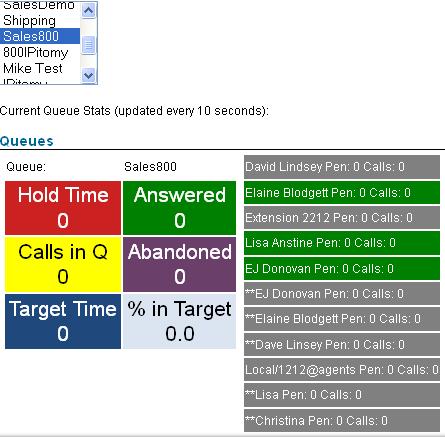
Navigation to Reporting Queue Monitoring, gains access to the page in the following diagram. This allows you to see a live Queue Status of selected Queues. This view is refreshed every ten seconds so it is a semi live status. The information field shows the following information fields.
1) Hold Time - This is the estimated hold time within the queue at the current time
2) Calls In Q - This is the total calls in Queue at this time connecting and holding.
3) Target Time - This shows the number of calls which have fallen outside the Target estimate
4) Answered - This displays Calls Answered
5) Abandoned - This is the Calls Abandoned display.
6) % in Target - This shows a percentage of calls Answered within Target Estimate.
Agent/Member Color Key: Green: Idle (logged in) Red: On a call Yellow: Ringing Grey: Unavailable (Not Logged In) White: Paused
